OI: Volume Profile
Auction structure in one glance — with flexible range + left/right anchoring for context and execution. Powered by VP Core × CLM Context (Closed-source).
OI: Volume Profile is a flexible, trader-first VP built for real decisions: POC/VAH/VAL structure, thin-row mapping, and optional split (up/down) flow view. Set it to auto-follow your visible range or lock it to a fixed lookback — and anchor it left or right so you can run a wide ‘context VP’ on one side and a tighter ‘execution VP’ on the other.
Built for readable states and repeatable workflows — not indicator overload.
Designed to improve timing and decision quality while keeping the chart clean.
Sensible controls grouped logically — start with defaults, then tune for your market and session habits.
Access is managed via originalindicators.com — purchase, submit your TradingView username, and you’ll be added to the invite-only list.
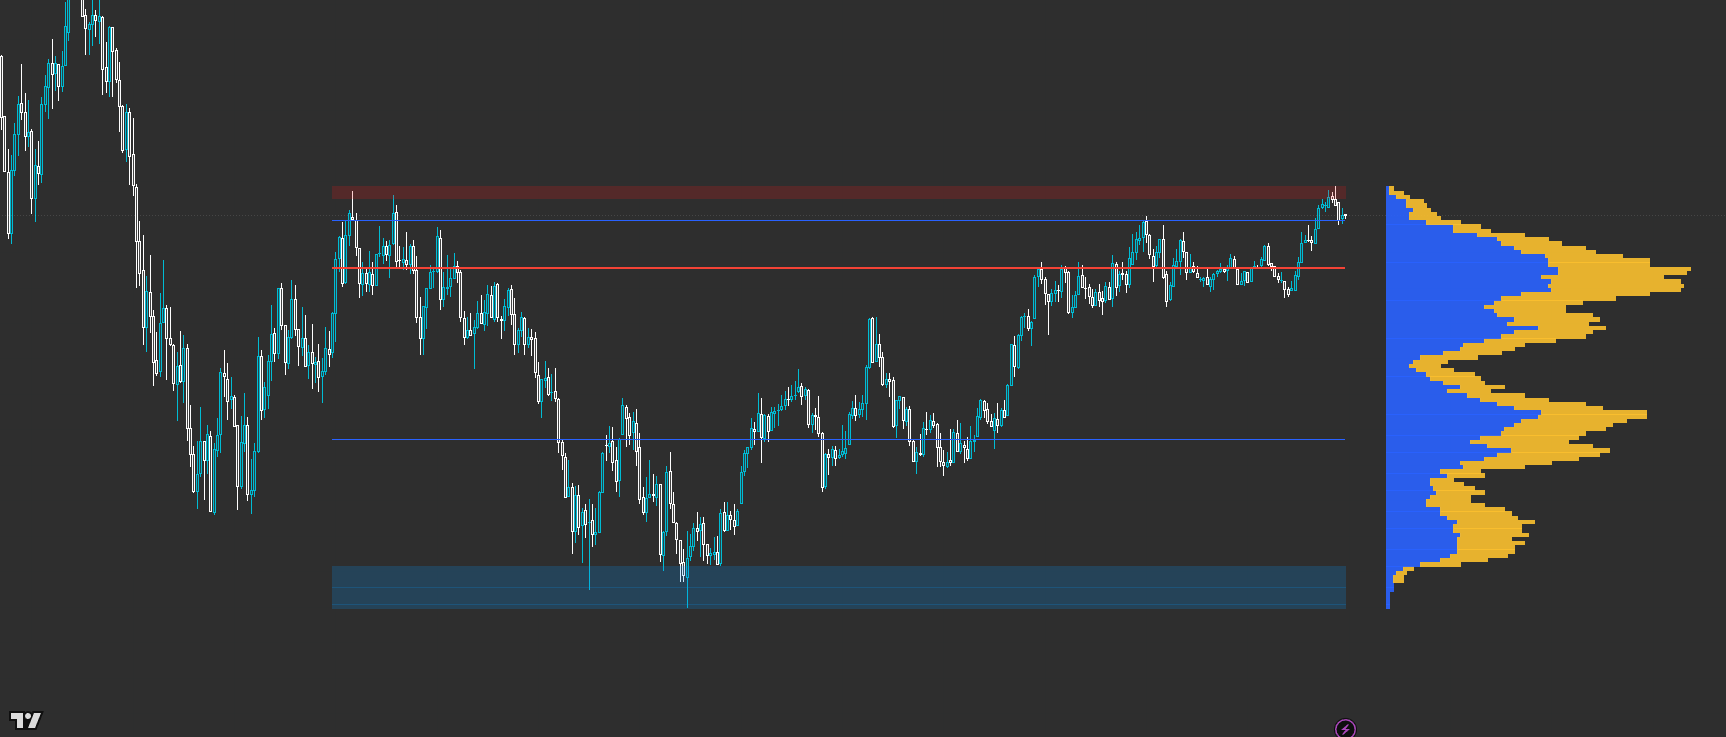
A VP histogram anchored left or right (your choice) with configurable width/resolution
POC line plus Value Area High/Low levels for structure and targets
Optional split (Up/Down) within each row for a quick pressure read
Thin-row highlights to show low-volume zones and potential fast-travel areas
Optional markers when price interacts with VA/POC zones (proximity-based)
Step 1 — Choose your range mode: Visible Range for ‘what I’m trading now’, or Fixed Bars for repeatable sessions.
Step 2 — Set your anchor side and width: use a wider VP for context, and a tighter VP for execution if you run multiple instances.
Step 3 — Read structure first: identify POC and Value Area to understand acceptance and likely rotation zones.
Step 4 — Use thin rows as ‘travel risk’ cues: price can move faster through low-volume areas; plan risk accordingly.
Step 5 — Treat VA/POC interactions as decision moments: wait for your structure confirmation (break/retest, rejection, reclaim) before committing.
Best for
- Mapping acceptance vs rejection using POC/VA structure
- Combining a large context VP with a tighter execution VP (left/right anchoring)
- Intraday trading where location and range definition matter
- Traders who want VP clarity without needing multiple separate tools
Not ideal for
- Anyone expecting a pure ‘signal-only’ indicator (this is structure + context first)
- Using VP without a defined range/session plan (range choice is part of the edge)
- Forcing trades in thin/quiet conditions instead of filtering participation
- Range source (Visible Range vs Fixed Bars) + Fixed lookback (bars)
- Anchor side (Left/Right) + Offset (bars) to fit your layout
- Resolution (rows) and Width (%) to match your instrument and timeframe
- Value Area % and which levels to display (VAH/VAL/POC)
- Split view on/off + thin-row threshold (keep it readable, not noisy)
Avoid over-tuning early
Start with defaults, learn the states, then tune for your main market and session habits. The edge comes from consistent execution, not constant parameter chasing.
How do I use this for both context and execution?
Add two instances: run a wider, longer-range VP for context and a shorter, tighter VP for execution. Use Left/Right anchoring so they don’t fight for space.
Visible Range vs Fixed Bars — which is better?
Visible Range is great for discretionary ‘what’s on screen’ decision-making. Fixed Bars is better for repeatable session workflows and consistent back-testing habits.
Does the split (Up/Down) view replace orderflow tools?
No — it’s a quick, lightweight pressure hint. It’s designed to help interpretation without turning your chart into a cockpit.
What’s the CLM part doing here?
CLM provides a closed-source context layer used to improve how the profile is interpreted and presented. You get the behaviour and the decision support without exposing the internal recipe.
Works across assets and timeframes — best used as a decision layer alongside your execution model.
Get Access