OI: Volume Alignment
See when volume agrees with price — spot chop, reversion, and sustainable trend early. Powered by Dual VDE (Track A + Track B) — Volume Participation Engine.
Volume Alignment visualises two closed-source participation tracks side-by-side so you can read whether volume is *supporting* the move or fading it. It’s a context tool (not a crossover system): the shape, slope, and position of both tracks tells you whether the market is trending, chopping, or setting up for mean reversion.
Built for readable states and repeatable workflows — not indicator overload.
Designed to improve timing and decision quality while keeping the chart clean.
Sensible controls grouped logically — start with defaults, then tune for your market and session habits.
Access is managed via originalindicators.com — purchase, submit your TradingView username, and you’ll be added to the invite-only list.
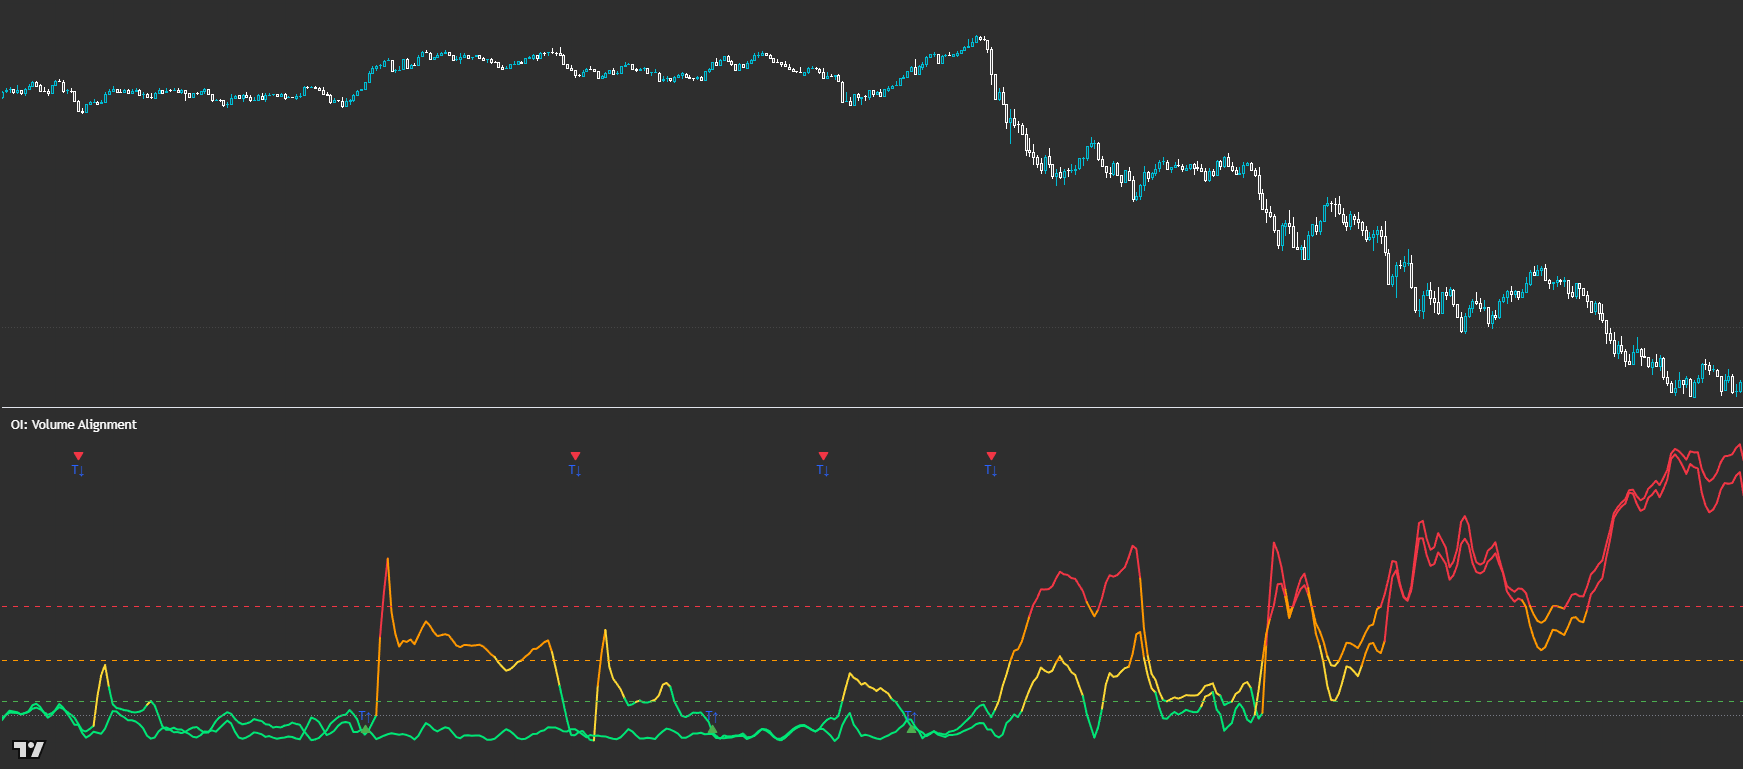
Track A and Track B lines that change colour as intensity increases
Horizontal reference zones for participation strength (base → alert → extreme)
Optional Trend-ST flip markers (T↑ / T↓)
Sync Pulse markers (SYNC / S↑ / S↓ / S•) when both tracks rise together from a low zone
Start with the *relationship* between the two lines (not a crossover).
Chop read: when tracks oscillate in a mirror-like way (back-and-forth participation) → reduce size, tighten rules, or stand down.
Mean reversion read: when one track shoots off without the other (participation imbalance) → look for reversion into structure/PD levels instead of chasing.
Trend start read: when both tracks rise together in a controlled way (alignment) → treat this as a ‘sustainable move’ cue and prioritise trend continuation playbooks.
Use Sync Pulse as a ‘pay attention’ event: pair it with structure confirmation (break/retest, PD reclaim, etc.), then manage risk normally.
Best for
- Confirming whether a trend is volume-backed (hold confidence vs early exit)
- Filtering chop and avoiding over-trading in noisy conditions
- Spotting mean-reversion setups when participation diverges
- Adding a volume-first layer to PD / structure-based execution
Not ideal for
- Trading simple crossovers (that’s not the read)
- Expecting a standalone entry/exit system without structure + risk rules
- Very low-liquidity / dead sessions where volume signals are less reliable
- Smoothing (reduce noise vs increase responsiveness)
- Move normalization (Pct vs ATR) to fit the market you trade
- Alert / Extreme / Participation thresholds (tune intensity bands)
- Sync Pulse window + max separation (how strict ‘together’ must be)
- Trend-ST flip markers on/off (keep it clean if you don’t use them)
Avoid over-tuning early
Start with defaults, learn the states, then tune for your main market and session habits. The edge comes from consistent execution, not constant parameter chasing.
Is this a crossover indicator?
No — treat it as a context tool. The key is how the two tracks behave together (alignment, divergence, and intensity), not where they cross.
How do I know it’s trend vs chop?
Chop tends to look like mirror oscillation (push/pull). Sustainable trends tend to show both tracks rising together in a steadier, more coordinated move.
What does it mean if one line spikes without the other?
That’s often participation imbalance — a common precursor to mean reversion. Instead of chasing, look for reversion setups into your structure/PD framework.
What is Sync Pulse?
A highlighted moment where both tracks rise together from a low zone. It’s a ‘wake up’ event — best used with structure confirmation and disciplined risk management.
Works across assets and timeframes — best used as a decision layer alongside your execution model.
Get Access